Project structure
After cloning, you'll find two starter config files. Use config_base.js as your blank slate and config.js as a fully populated reference.
repository roottree
RoadmapSnap/
```

├── index.html          # the rendering engine — never edit this
├── js/
│   ├── config.js       # ← your roadmap lives here
│   └── config_base.js  # blank template to start from
├── css/                # styles (customise for branding)
└── docs/
└── preview.png
💡
Start from the base template
Copy config_base.js over config.js to start clean. Study config.js (the e-commerce sample) whenever you need a working example of any feature.
```
Defining deliverables
Each item in the DELIVERABLES array represents one row in your timeline. The only two required fields are name and milestones.
js/config.jsjavascript
DELIVERABLES: [
```

{
name:  “User Authentication”,  // required — must be unique
group: “Backend”,             // optional — groups rows together
milestones: {              // required — at least one date
M0: “01/03/2026”,
M1: “30/03/2026”,
M3: “01/05/2026”
}
}
]
| Field | Type | Required | Description |
|---|
name | string | Required | Unique identifier and label shown in the timeline row |
group | string | Optional | Organises rows under a labelled group/stream header |
milestones | object | Required | Key-value pairs of milestone key → date (DD/MM/YYYY) |
showInTimeline | boolean | Optional | Set to false to hide the row from the Gantt (default: true) |
```
Setting milestones
Milestone keys must match the keys defined in your WORKFLOW. Status (Not Started / In Dev / Done / etc.) is automatically calculated at runtime based on which milestone dates have passed relative to today.
js/config.jsjavascript
// Milestones use DD/MM/YYYY format
```

milestones: {
M0: “01/03/2026”,   // Dev kickoff
M1: “28/03/2026”,   // Dev complete
M2: “18/04/2026”,   // UAT signed off
M3: “05/05/2026”    // Go live — you don’t need all milestones
}
✅
You don’t need every milestone
A deliverable only needs the milestone dates that are relevant to it. If an item has no M2 date it will simply skip from M1 to M3 in the status calculation.
```
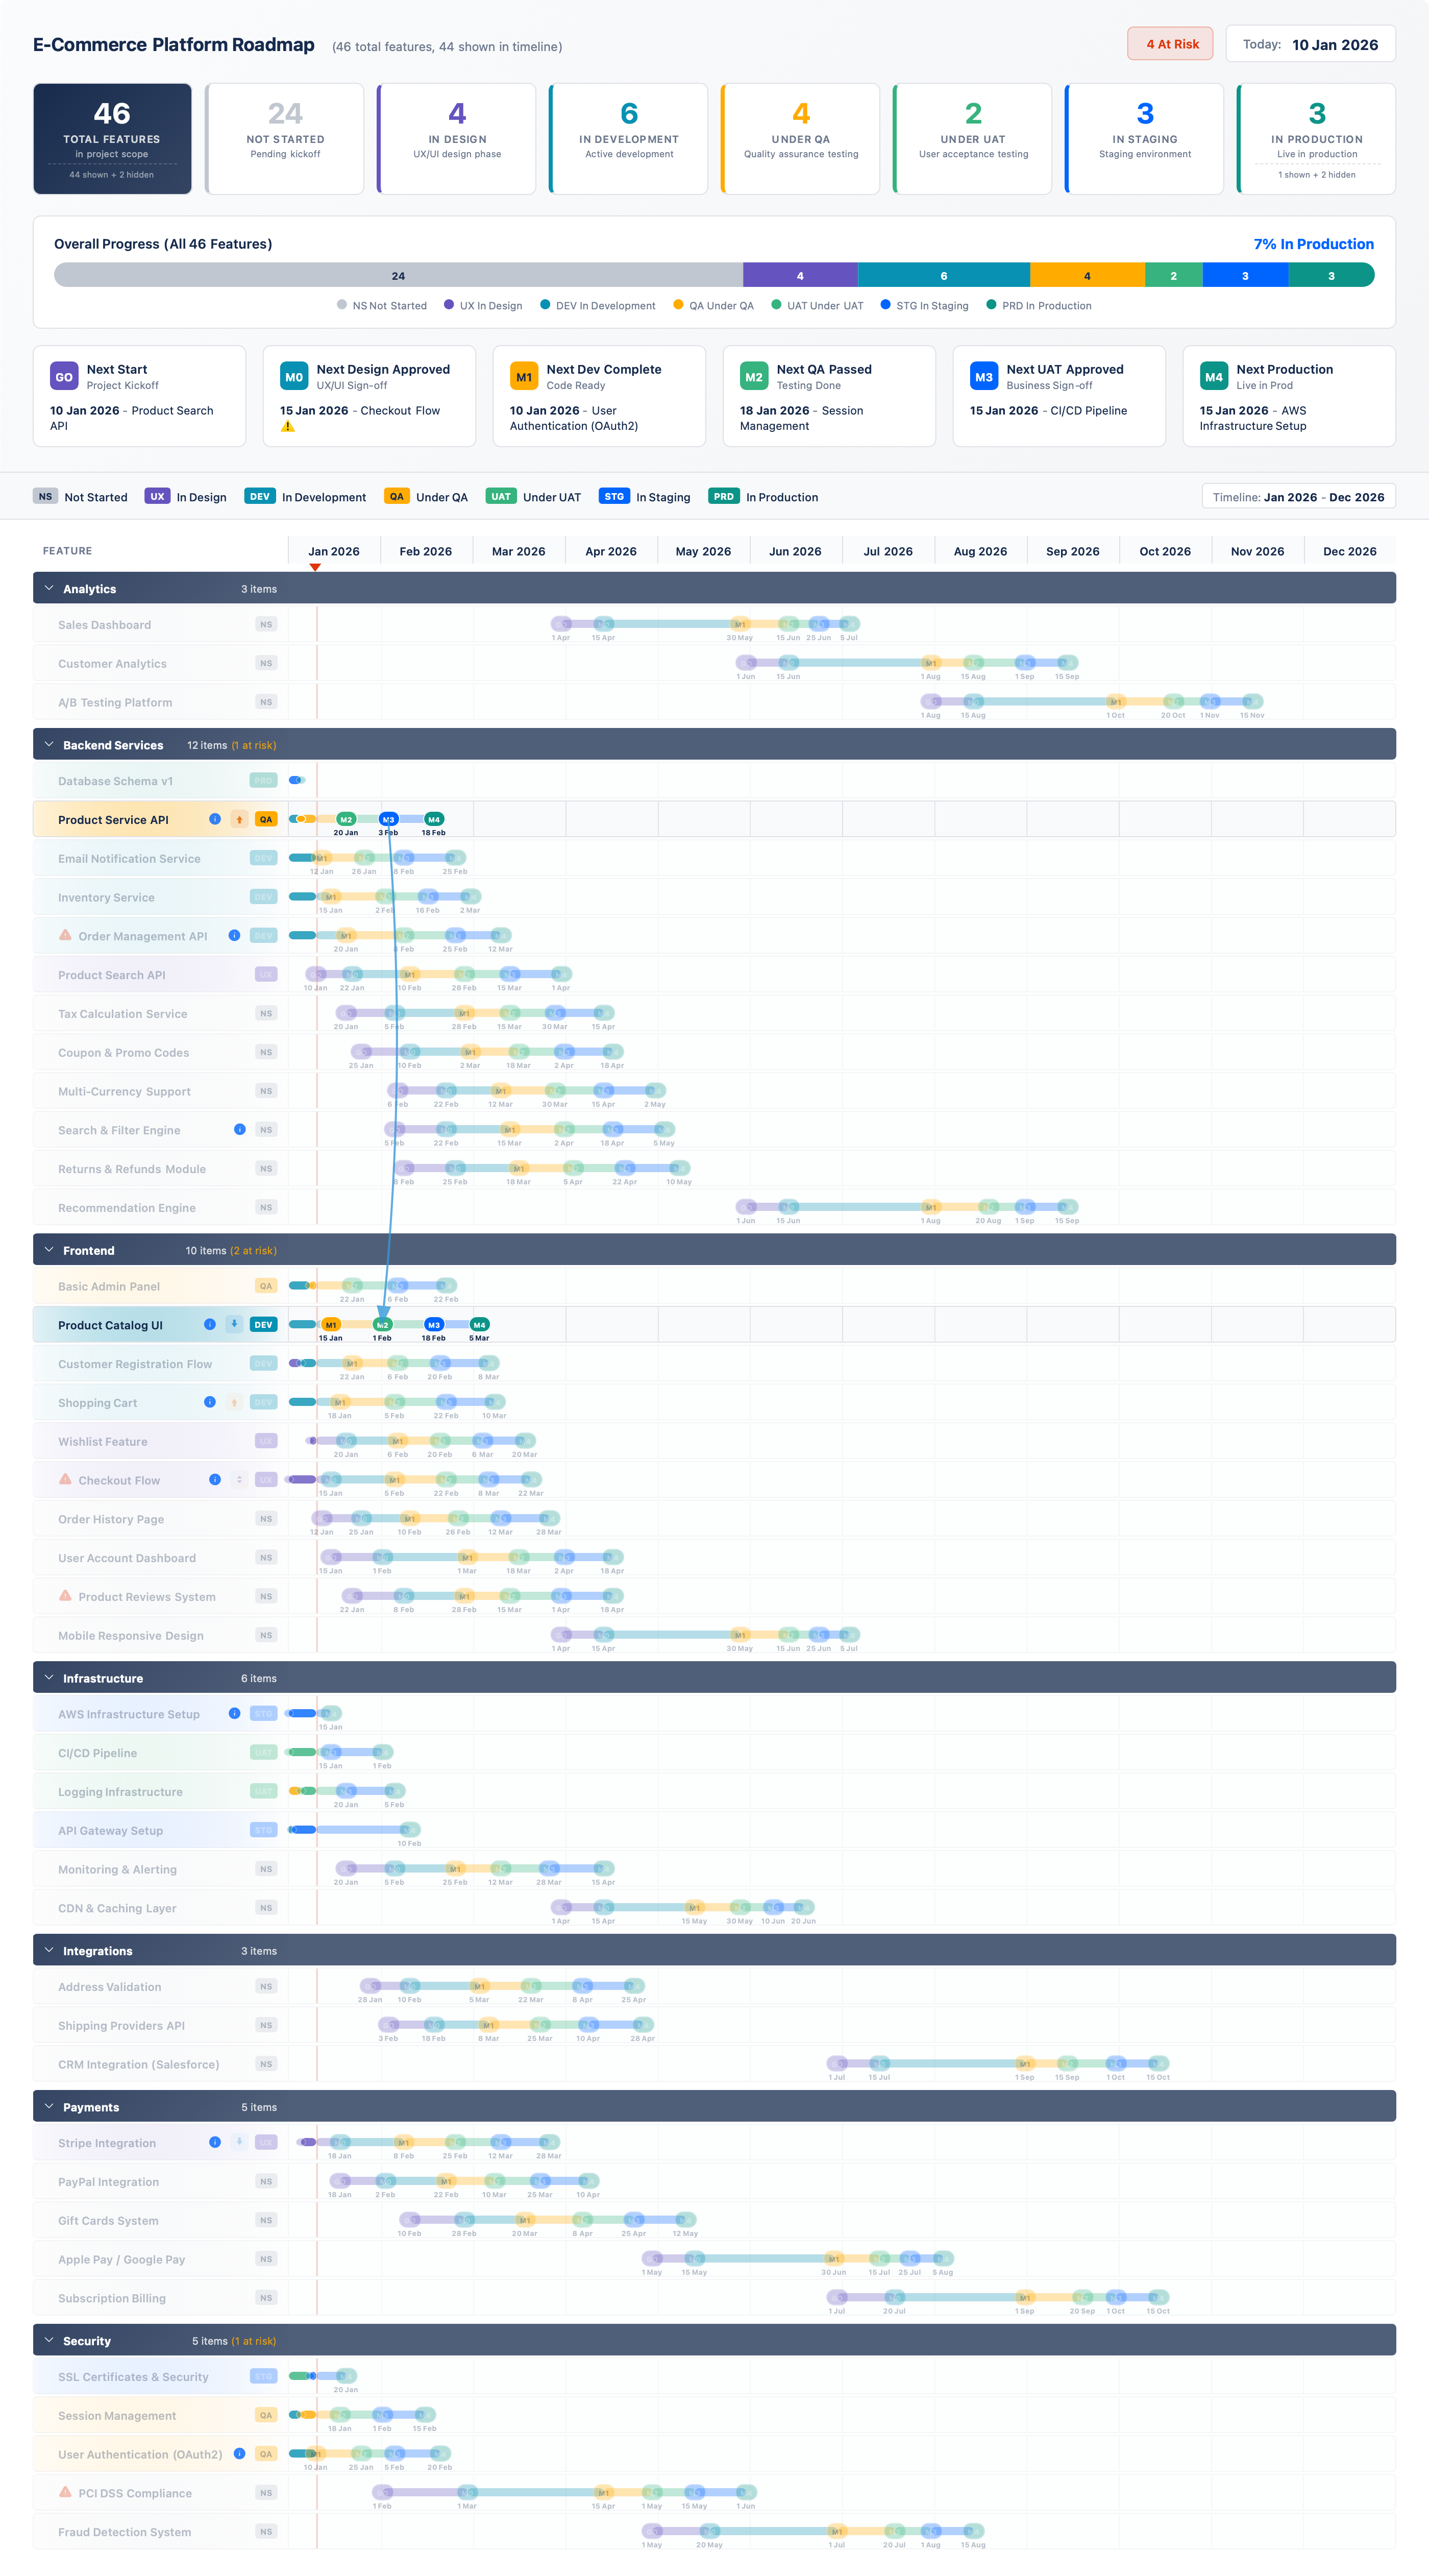
Tracking dependencies
Dependencies tell RoadmapSnap which deliverables are blocked by others. They are visualised as a recursive arrow graph in the dependency view. There are two ways to define them.
Simple dependency
A string with another deliverable's exact name. Links the last milestone of that deliverable to the start (M0) of this one.
Advanced dependency
An object with task, from, and to to link specific milestones between two deliverables.
js/config.jsjavascript
{
```

name: “API Gateway”,
dependencies: [

```
// Simple: "Database Setup" M3 → "API Gateway" M0
"Database Setup",

// Advanced: "Auth Service" M1 must complete before
// "API Gateway" M1 can start
{ task: "Auth Service", from: "M1", to: "M1" },

// Another example: DB migration M2 → this item's M1
{ task: "DB Migration", from: "M2", to: "M1" }
```

],
milestones: { M0: “15/03/2026”, M1: “20/04/2026”, M3: “10/05/2026” }
}
```
⚠️
Names must match exactly
The task string (or the simple string) must be the exact name of another deliverable in the same config — including case and spacing. A mismatch silently omits the dependency arrow.
1
Identify the blocking deliverable
Find the deliverable whose completion gates another one. Note its exact name value.
2
Choose simple or advanced
Use a plain string if the default "last milestone → M0" link is sufficient. Use the object form to connect specific milestones.
3
Add to the dependencies array
You can mix strings and objects freely in the same array. Multiple dependencies per deliverable are fully supported.
4
Check the dependency view
Reload and switch to the dependency graph tab. Arrows will appear between the linked milestones, and blocked items will be highlighted.
```
Linking to Jira, Confluence & other tools
The link field attaches a clickable icon to any deliverable row in the timeline. Use it to point directly to the Jira epic, Confluence page, or any other URL relevant to that item.
js/config.jsjavascript
{
```

name: “Data Warehouse Setup”,
tags: [“data-eng”, “P0”],

// Links to a Jira epic
link: “https://your-org.atlassian.net/browse/DATA-142”,

milestones: { M0: “01/02/2026”, M1: “28/02/2026” }
},
{
name: “Auth & SSO”,

// Links to a Confluence design doc
link: “https://your-org.atlassian.net/wiki/spaces/ARCH/pages/123456”,

milestones: { M0: “10/02/2026”, M1: “15/03/2026”, M3: “01/04/2026” }
}
🎫 Jira epics & stories
Link directly to the epic or story covering this deliverable. Stakeholders can drill in without asking the PM for the ticket number.
📄 Confluence pages
Point to the design document, PRD, or decision log. Makes the roadmap a genuine entry point to all program artefacts.
📁 SharePoint / Drive
Any HTTPS URL works — SharePoint folders, Google Drive docs, Monday boards, Notion pages.
🔗 One link per deliverable
Only one link is supported per row. Use the most useful destination — typically the Jira epic or the Confluence spec page.
💡
The icon appears inline in the timeline row
When a link is set, a small info icon appears next to the deliverable name. Clicking it opens the URL in a new tab. It doesn’t affect the bar or milestone rendering.
```
Risk & descope flags
Two boolean flags let you surface delivery risk and scope changes visually — without touching the Gantt bars or milestone dates.
js/config.jsjavascript
{
```

name: “Mobile App v2”,
atRisk:   true,   // shows a ⚠️ risk indicator on the row
descoped: false,  // strikes through and greys out the row
milestones: { M0: “01/05/2026”, M1: “30/06/2026” }
},
{
name: “Legacy Portal Shutdown”,
atRisk:   false,
descoped: true,   // removed from scope — shown crossed out
milestones: { M0: “01/03/2026” }
}
⚠️ atRisk: true
Adds a visible risk indicator to the timeline row. The item still counts in the “at risk” KPI card. Click the KPI card to filter to all at-risk items.
🚫 descoped: true
Strikes through the row and renders it grey. The item is still visible (useful for auditing scope changes) but excluded from active KPI counts.
```
Groups & ordering
Groups organise the timeline into labelled stream sections. Use GROUP_ORDER to control how they appear top-to-bottom. Groups not listed will appear alphabetically after the explicitly ordered ones.
js/config.jsjavascript
// Controls top-to-bottom stream order in the timeline
```

GROUP_ORDER: [“Data Platform”, “Integration”, “Frontend”, “Infrastructure”],

// Groups listed here won’t appear in the filter dropdown
NON_FILTERABLE_GROUPS: [“Infrastructure”, “Planning”]
✅
Use NON_FILTERABLE_GROUPS for overhead items
Infrastructure, planning, and governance work often shouldn’t appear in team-level filters. Add these group names to NON_FILTERABLE_GROUPS and they’ll always show but won’t appear as filter options.
```
Custom workflows
The WORKFLOW array defines your entire lifecycle. States and milestones must alternate. RoadmapSnap calculates each deliverable's current status by comparing milestone dates to today.
js/config.jsjavascript
WORKFLOW: [
```

{ type: ‘state’,     key: ‘NS’,   title: ‘Not Started’     },
{ type: ‘milestone’, key: ‘START’, title: ‘Kickoff’,      color: ’#7C3AED’ },
{ type: ‘state’,     key: ‘BUILD’, title: ‘In Build’        },
{ type: ‘milestone’, key: ‘M1’,    title: ‘Build Complete’, color: ’#059669’ },
{ type: ‘state’,     key: ‘TEST’,  title: ‘In Testing’      },
{ type: ‘milestone’, key: ‘M2’,    title: ‘Test Sign-off’,  color: ’#D97706’ },
{ type: ‘milestone’, key: ‘GO’,    title: ‘Go Live’,       color: ’#DC2626’ },
{ type: ‘state’,     key: ‘DONE’,  title: ‘Done’            }
]
💡
The keys become your milestone names
Whatever you set as key in a milestone workflow entry is what you use in each deliverable’s milestones object. You can rename them to anything — M0/M1/M2, KICKOFF/BUILD/UAT/GOLIVE, or any other convention.
```
Timeline settings
Control the visible date range and the today marker. Leave TODAY empty to auto-detect from the system clock.
js/config.jsjavascript
TIMELINE: {
```

TODAY:       “16/02/2026”,  // DD/MM/YYYY  or “” for auto
START_MONTH: “01/2026”,     // MM/YYYY — left edge of Gantt
END_MONTH:   “12/2026”      // MM/YYYY — right edge of Gantt
}
✅
Set TODAY manually for static presentations
If you’re exporting to PNG for a board pack or status report, set TODAY to a fixed date so the today-line appears in exactly the right place in the export, regardless of when it’s opened.
```
Custom labels & branding
Change the vocabulary of the dashboard to match your program. Replace "Feature" with "Initiative", "Epic", "Project", or any term your stakeholders use.
js/config.jsjavascript
ENTITY_LABELS: {
```

singular:   “Initiative”,
plural:     “Initiatives”,
scopeLabel: “initiatives”   // lowercase for sentence use
},

DASHBOARD_TEXT: {
title:                “Digital Transformation 2026”,
totalSubtitleSuffix: “in scope”
}
💡
Branding via CSS
For logo and colour changes, edit css/styles.css. The CSS uses straightforward class names and custom properties — no deep knowledge of the rendering engine needed.
```
Exporting & sharing
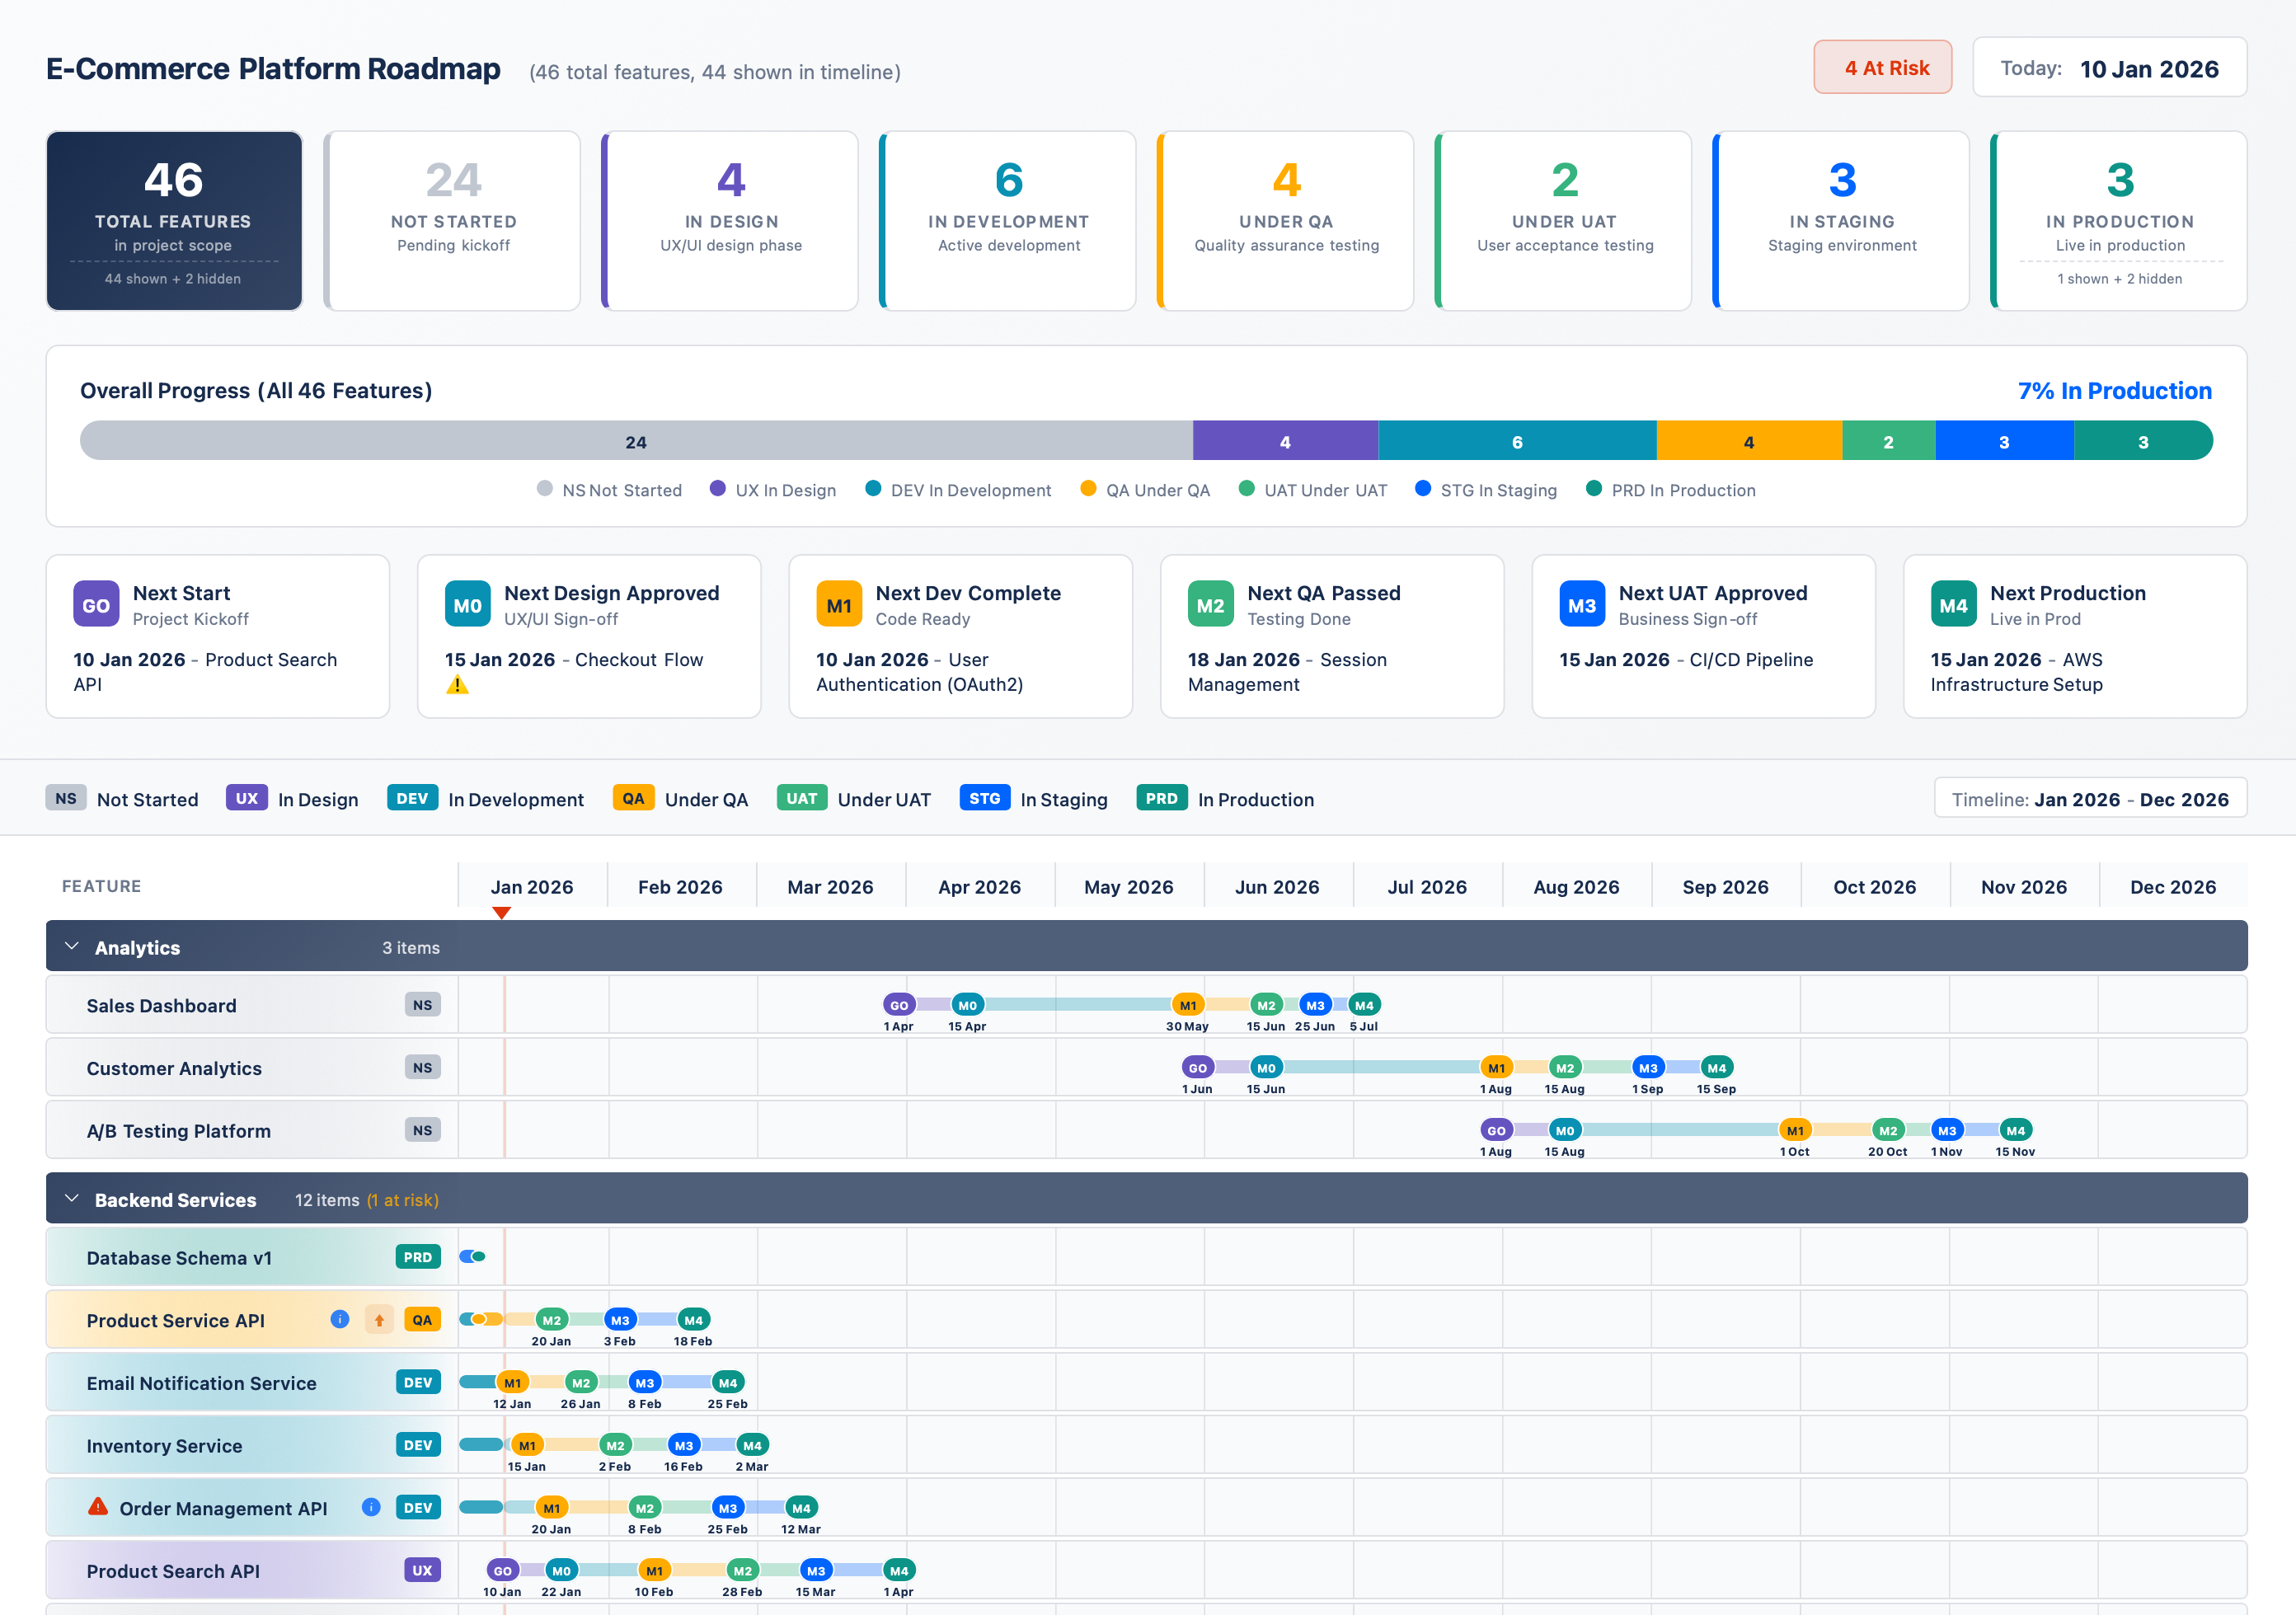
RoadmapSnap supports three export formats, all accessible from the toolbar inside the dashboard.
📷
PNG export
Captures the current viewport as a clean, high-resolution image. Best for embedding in slide decks, board packs, and status reports. Set a fixed TODAY date before exporting for reproducible snapshots.
📊
CSV export
Exports all deliverable data as a flat table. Useful for feeding into reporting tools, pivot tables, or for audit trails. Includes name, group, milestone dates, status, and flags.
{}
JSON export
Full structured export of the rendered state. Use for integration with other tools, archiving point-in-time snapshots, or generating reports programmatically.
✅
Sharing sensitive roadmaps
For programs with confidential data, use a private GitHub repository and enable GitHub Pages access controls, or deploy to an internal intranet. You can also create a sanitised config.public.js with only the information safe to share externally.